Dashboard
This module serves as an integrated dashboard that provides users with an overview of key data and quick action entries.
The screenshots shown below are for testing purposes only.
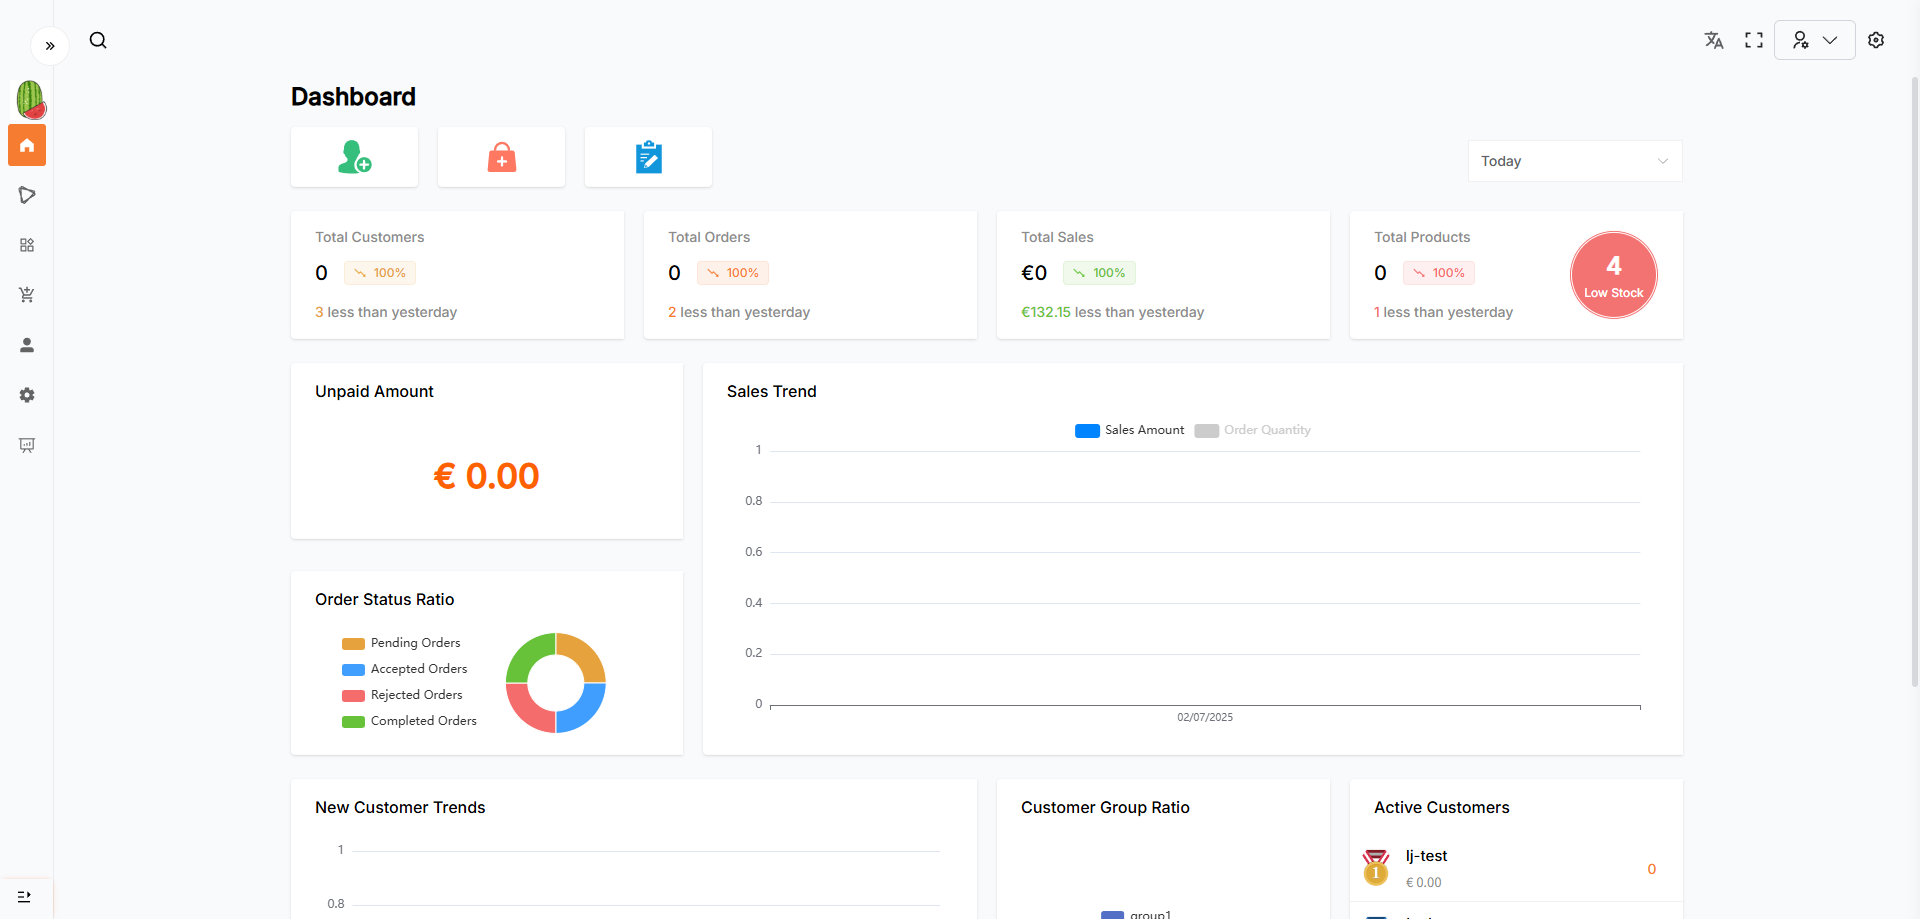
Key Metrics
- Total Customers: Displays the number of customers in the selected date range.
- Total Orders: Displays the number of orders in the selected date range.
- Total Sales: Shows the total sales amount during the selected period.
- Total Products: Shows the change in the number of products and highlights the number of low-stock products.
Real-Time Alerts & Monitoring
- Low Stock Alerts: Highlights the number of low-stock products on the right side.
Clicking the alert navigates to the Inventory page to view those products and take action in time. - Unpaid Amount: Highlights the total amount of unpaid orders for quick visibility.
Data Visualization (Dynamic by Date Range)
- Sales Trend: A line chart showing the trend of sales amount and order volume over time.
Supports hover to view detailed data points. - Order Status Ratio: A pie chart visually showing the distribution of order statuses.
- New Customer Trend: Tracks the number of new customers over time, helping to analyze customer growth and engagement.
Customer & Order Distribution Analysis
- Customer Group Ratio: Visualizes customer distribution by group to better understand customer segmentation.
- Active Customers: Displays the number of active customers and their corresponding total spending.
Quick Actions
- Quick action buttons are provided at the top to create a Customer, Product, or Order with one click.
Time Range Filter
- Users can switch between different date ranges to update the dashboard view accordingly.
- Supported ranges: Today, Last 7 Days, Last 14 Days, Last 30 Days.